Recently the Australian Institute of Health and Welfare (AIHW) published Housing assistance in Australia 2022 which provides information about accommodation and rental subsidies provided to lower income households.
In their media release it was the overall decline in social housing they chose to highlight. As the AIHW spokesperson said ‘while there has been a steady increase in the number of households in social housing over the decade to mid-2021 social housing has not kept pace with the growth in the overall number of households in Australia,’
Overall social housing numbers have increased by only 10,897 (or by 2.6%) in ten years 2012-2021 (Figure 1). This compares to population growth between 2011-2020 of 15%.
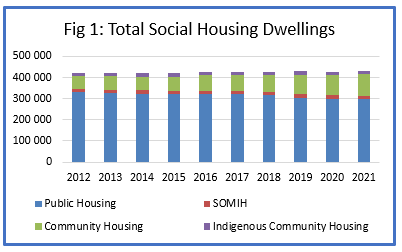
Public housing numbers have decreased in all states and territories; in NSW and TAS largely due to transfers to community housing but in other jurisdictions, most significantly SA, which has lost almost 22% (circa 9000 homes) of its 2012 total; only 50% can be attributed to management / property transfers – circa 9000.
Also last week, the ABS released the first tranche of Census data. Most media attention was reserved for the one million homes that were unoccupied on census night. Ranging from 6.6% of dwellings in ACT to 12.8% in NT. While in proportionate terms the empty homes rates had come down in every state and territory since 2016, in some LGAs covering popular holiday locations, the percentage of unoccupied homes is more than 20%, for example – 21.5% in Alpine shire, 24.1% in Snowy Monaro and 27.3% in Eurobodalla. At a time of high unaffordability it is understandable that there are calls for taxes on empty homes although the experience in Victoria suggests the results aren’t stellar. Vancouver is a more positive example with CAN $32M raised, going into new affordable housing in 2020.
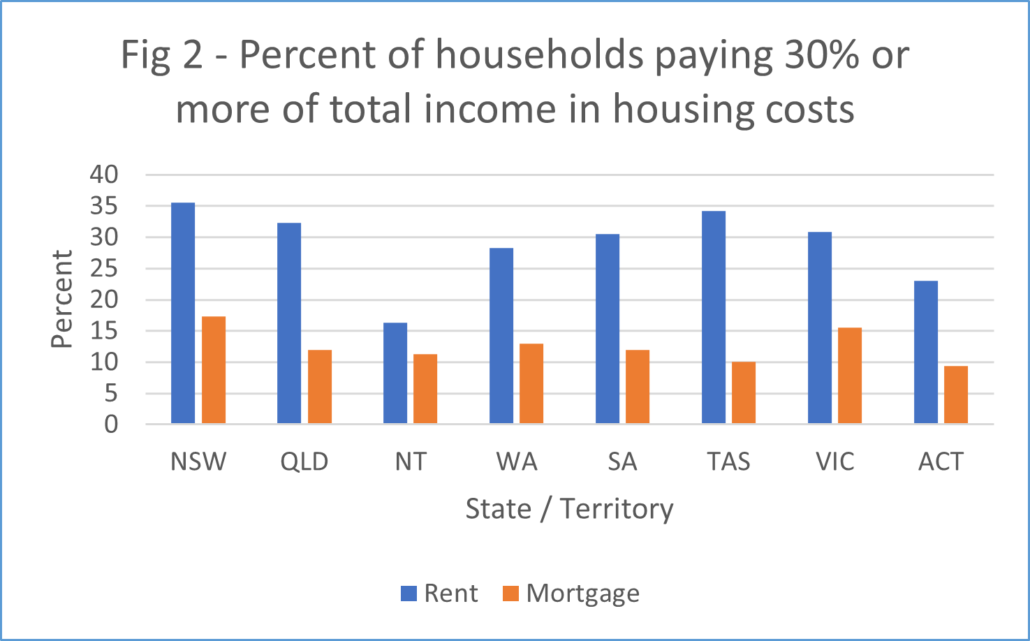
The census data also includes estimates of rental and mortgage affordability; distinguishing between households where housing payments are above or below 30% of total income. (See Fig 2) It is not yet possible to calculate rental or mortgage stress as the data isn’t available in a format to disaggregate housing costs for the bottom two income quintiles. However, delving deeper into local breakdowns for NSW, the SMH has identified that lower income neighbourhoods had higher percentages of households paying more than 30% of income in housing costs. They reported, ‘in Fairfield, 55 per cent of tenants were paying over 30 per cent of household income on rent, while in Greenfield Park-Prairiewood the share was 52.3 per cent and in Condell Park 51.7 per cent.