The 2024 ROGS housing and homelessness report and statistics were published on 22 January 2024. This statistical release is as near as we have to any kind of official routinely published national dataset of social housing provision, need and performance. However, anyone familiar with this annual output will be aware that, the different State and Territory data reporting policy and practice make inter-sector and jurisdictional comparisons somewhat fraught. That said it is still one of the only national sources of social housing data we have and has the authority of a government agency behind it.
Our analysis of Productivity Commission government services data reveals total social housing stock has grown at just a third of the rate of Australia’s population in the decade to 2022-23. Public and community housing stock numbers increased by just 21,744 or 5.2 per cent since 2012-13, far slower than overall population growth of 15.1 per cent.
The result, as confirmed by the recent census, is that public and community housing has dwindled to only 4 per cent of all housing.
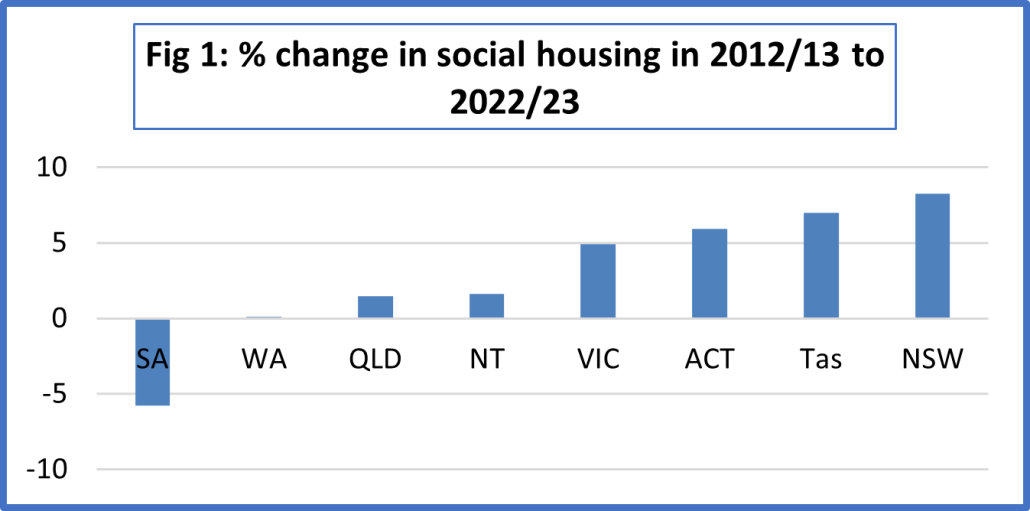
Growth in social housing has varied considerably between states and territories (see Fig 1 below). In SA in particular, there has been a considerable decrease in numbers – a reduction of 3,424 or 5.7%. NSW accounts for the lion’s share of the national ten year increase – 11,983 homes equating to 55% of the national increase. This is mainly a legacy from the social housing units generated through leveraging the SHI-funded homes, the Miller’s Point sales reinvestment, and the Social and Affordable Housing Fund.
The COVID-19-triggered introduction of State-funded social housing stimulus investment programs in some jurisdictions is, however, leading to a change in the pecking order. In the last year, VIC (responsible for 56% of the national net increase), TAS and QLD have all added to social housing, while there have been net reductions in NSW, WA and SA. In NT there has been a small increase. The ACT figures, while looking good, are probably misleading as they include a large provider for the first time. VIC, it should also be acknowledged, oversaw a reduction in social housing dwellings of 509 between 11/12 and 20/21 so has some catching up to do.
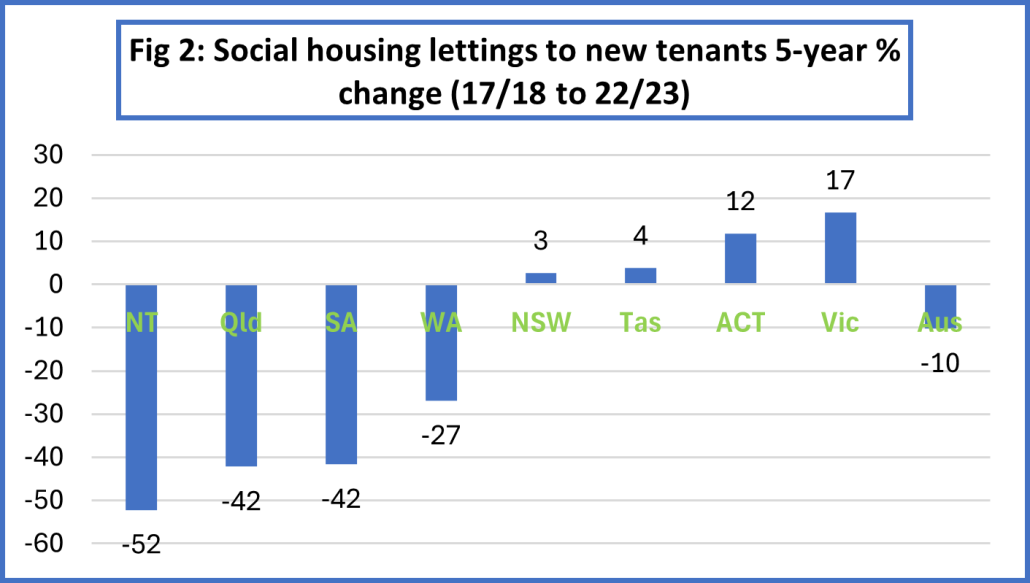
To better understand how the social housing system is responding to need, we should also look at how many applicant households are being assisted (allocated) social housing each year. We used data to estimate the change in numbers of households assisted via public housing, community housing or SOMIH between 17/18 and 21/22. Excluded from these figures ‘new tenancies’ created by community housing organisations simply because of a transfer of management from public housing. It shows lettings to applications new tenants are down 38 per cent, in nominal terms, from 1991. But adjusted to population growth, the 2022-23 figure is 59 per cent lower. Even s Since 2017-18, allocations proportionate to population have declined by 14 per cent. (see Fig 1) This during a period when the growing shortage of rentals affordable to low-income Australians means the country needs more, not less, non-market housing.
We also attempted to estimate the additional new social housing that state and territory governments expect to complete or contract over the next five years. This estimation is derived from the implementation plans (see here) prepared by each jurisdiction as a condition of receiving their share of the Commonwealth’s $2 billion social housing accelerator fund.
With the exception of Victoria and the smaller states and territories, there were common interpretation problems mainly and, critically, a failure to identify net (rather than gross) additions to stock. Also, in NSW and QLD an undisclosed amount of affordable housing is included, (1) making comparisons difficult, and (2) casting doubt on the veracity of the total. Without more precisely and consistently specified numbers, the state/territory figures provide a weak basis for accountability in terms of actual delivery in coming years.
Nevertheless, if it is genuinely additional to the 20,000 social housing promised under the HAFF, the 33,049 dwelling pipeline estimated from the implementation plans represents a substantial quantum of new homes committed. Add to that the 20,000 affordable rental homes to be contracted under the HAFF and NHAF, plus additional affordable housing planned in VIC and ACT, and the social and affordable housing forward program while not sufficient appears healthier than at any time since 2011.